4 Jun 2026
Mapping Completion Rates Across Branching Storylines in Choose Your Own Adventure Style Streaming Content
Streaming platforms have expanded their use of choose-your-own-adventure formats since the late 2010s, and analysts now track how viewers navigate these nonlinear stories through detailed completion rate mapping. Data collection focuses on decision points where users select paths that alter narrative outcomes, and platforms record the percentage of audiences who reach each endpoint across multiple branches. This approach reveals patterns in viewer persistence without relying on traditional linear viewing metrics.
Tracking Mechanisms in Interactive Narratives
Engineers at major services log every choice timestamp along with the selected branch identifier, then aggregate these entries into heatmaps that highlight high-dropoff junctions versus those sustaining engagement through to credits. Researchers have observed that branches exceeding twelve minutes in length often see completion rates fall below sixty percent, while shorter segments maintain viewer momentum when they introduce immediate consequences for prior decisions. These measurements draw from server-side logs that capture device type, session duration, and repeat viewings where users explore alternate routes.
Platforms integrate A/B testing frameworks to compare completion across variant story structures, and figures from industry reports indicate that personalization algorithms adjust branch recommendations based on aggregate drop-off data collected in real time. One study released in early 2025 by the European Audiovisual Observatory documented how metadata tags attached to decision nodes allow rapid recalculation of completion probabilities when new viewer cohorts enter the system.
Regional Variations in Audience Behavior
Completion patterns differ across geographic markets because cultural preferences influence tolerance for extended decision trees, and analysts note higher persistence rates in regions where serialized television already emphasizes multiple character perspectives. Data compiled by the Australian Communications and Media Authority shows that audiences in Oceania complete an average of 3.2 branches per interactive title compared with 2.1 branches among North American viewers, a distinction attributed to differences in average session lengths rather than content quality alone. These statistics emerge from anonymized telemetry collected across thousands of titles released between 2023 and 2025.
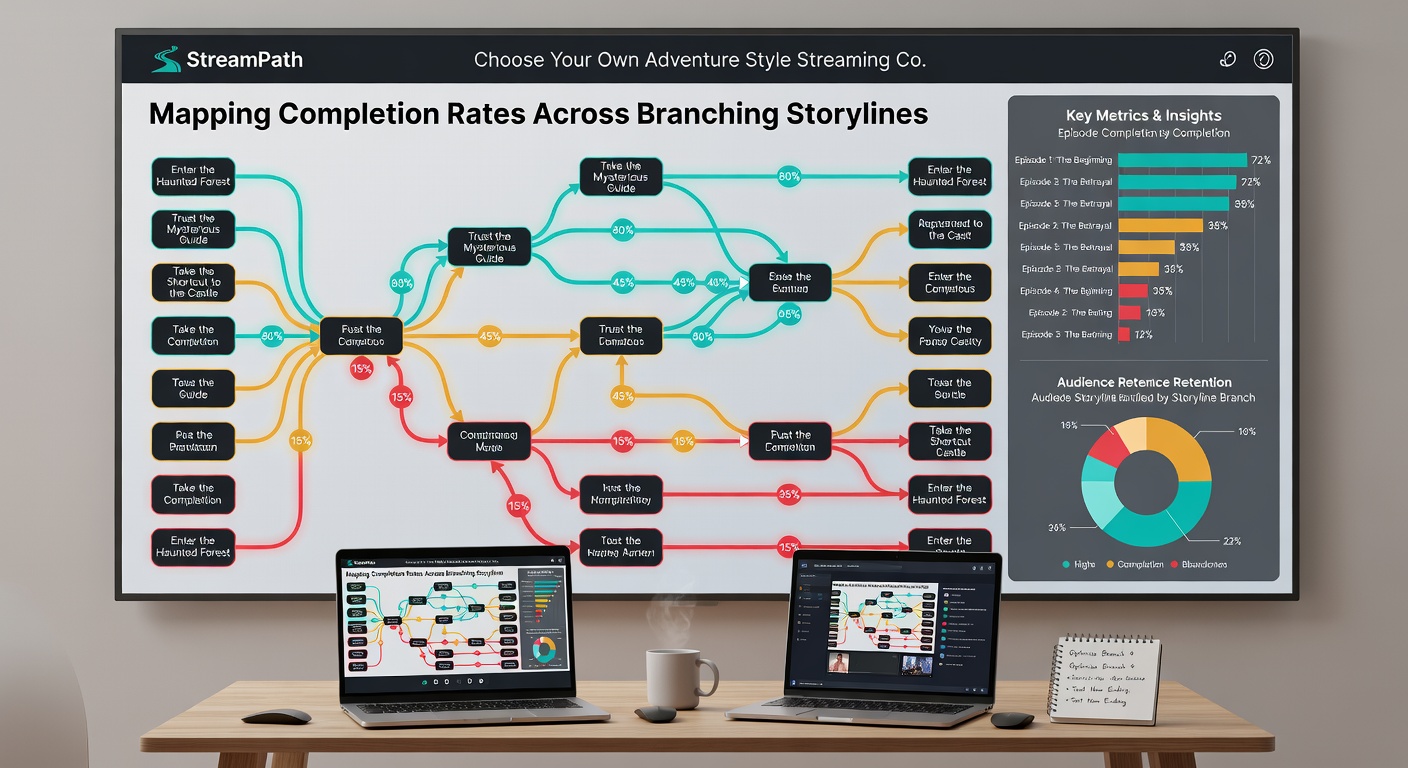
Analytical Tools and Visualization Methods
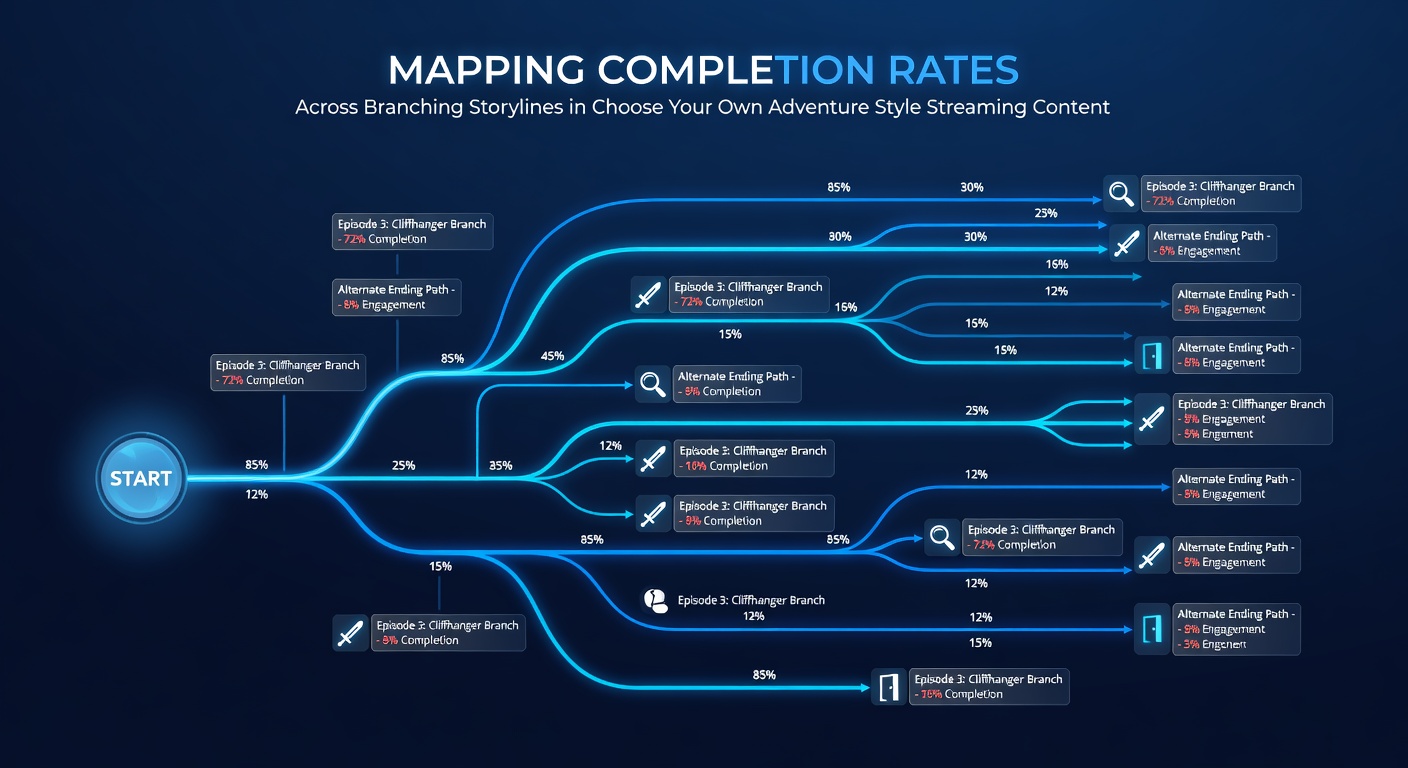
Specialized dashboards convert raw choice logs into Sankey diagrams that illustrate flow volume between decision nodes, and developers refine these diagrams monthly to incorporate new titles entering catalogs in June 2026. Machine learning models trained on historical completion data predict the likelihood that a given viewer will finish a specific branch, then surface that prediction to content strategists who adjust runtime allocations accordingly. Observers note that such predictive layers reduce unnecessary production of low-engagement segments while preserving narrative depth in high-completion pathways.
Universities contribute independent verification through controlled experiments that recreate simplified branching interfaces in laboratory settings, and findings published by the University of Southern California confirm that visual cues at decision points correlate with a fifteen percent increase in branch exploration when those cues match the aesthetic of the surrounding scene. These academic datasets supplement proprietary platform metrics and help standardize measurement protocols across competing services.
Future Developments in Data Integration
Upcoming platform updates scheduled for mid-2026 will embed completion rate mapping directly into recommendation engines, allowing real-time rerouting of viewers toward branches that align with their demonstrated persistence patterns. Integration with cross-device viewing histories further refines these models because users frequently resume sessions on different screens after initial branch selections. Industry consortia continue to develop shared schemas for logging decision metadata so that smaller producers can apply the same analytical rigor previously available only to large studios.
Conclusion
Mapping completion rates across branching storylines supplies streaming services with granular insight into audience navigation habits, and the resulting datasets guide both creative decisions and technical optimizations. Continued refinement of tracking tools and cross-regional comparisons will shape how choose-your-own-adventure content evolves in the years ahead.